The heat and running: How much will the sun slow you down? (Part 1)
Hot & Slow…
I had two half-marathon races last month, and the results were very different and unpredictable. I hoped for better outcomes, but the sun was too much for me in both cases. Immediately, I compared the results with those of a previous half marathon where I had a good racing time, and I remember it was cloudy from start to end without any sun.
After discussing the temperature problem with fellow runners, some pointed out that it is not just the temperature but also the humidity. Initially, I fell into this trap, but I soon realized that all three races were in cities with seaside or rivers, and the one with the best result even had light rain from time to time. I expected a high humidity index for all three of them.
The first problem I discovered was that Garmin weather data could have been more reliable. I started with the temperature, which was way off from what I felt and saw during the race.
Let’s compare the half marathons of Prague on 04/06/2024, Lisbon on 03/17/2024, and Cardiff on 10/01/2023.
Why Garmin data is garbage?
Garmin uses your phone to collect data about the weather. If you don’t run with your phone, you will see strange weather reports. Looking at my Prague race, you can see two values for the weather for the same race in the Garmin activity:
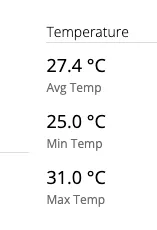
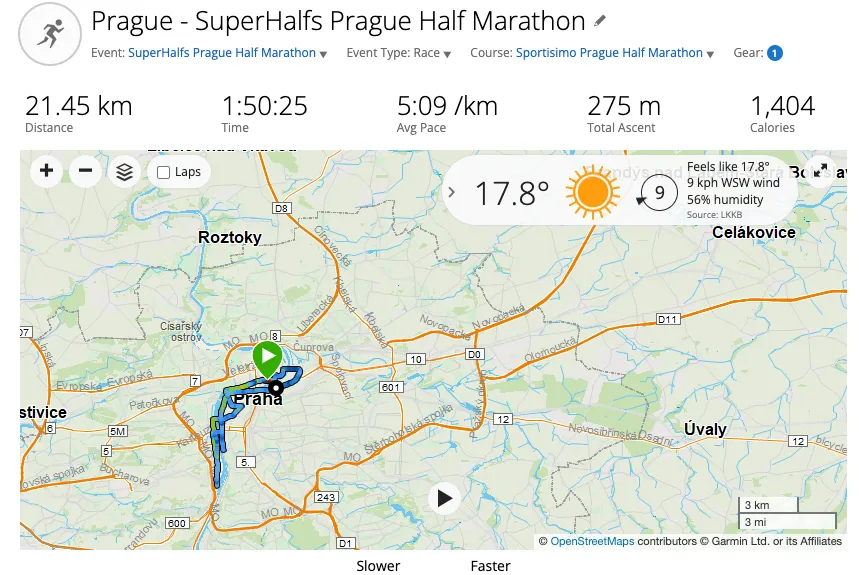
I found the following explanations on Garmin’s help pages:
Why doesn’t the weather widget information match the weather app on my smartphone?
The weather information displayed on your device’s weather widget is collected from the official weather station closest to your starting point. For the most part, local airports will be the official weather stations. The source of your smartphone’s weather app may be different from the source from which your device’s weather widget data is collected.
Long story short, you have to disregard the weather data captured by Garmin since this can be completely off compared with the actual conditions. In fact, for all my races, I find the Garmin-recorded temperature to be questionable and not accurate.
How to Get Historical Weather Data
This was a bigger problem than expected. Getting historical hourly weather data is not easy. I tried multiple sites, but none of them worked. Ultimately, I stumbled on the Visualcrossing.com website, where you get historical data on the free tier.
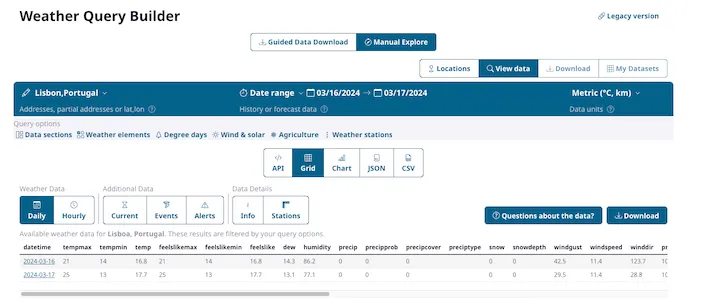
If you subscribe to the free tier, you’ll be able to get the historical data, even on an hourly basis. I think this is a good start, and now I have everything I need to compare my races and the “official” data with my perception of the races.
I will compare 3 Half Marathon races. I’ve chosen the last 3 SuperHalfs races and the International Half Marathon of Bucharest:
- My most recent race was the Prague Half Marathon on 04/06/2024. During this race, I felt the heat from start to end and had a not-so-good result, below my expectations.
- The Lisbon Half Marathon on 03/17/2024, a race two weeks before Prague, where the heat was also something I complained about, but here I felt the heat around km 11. Until that point, I was running well.
- The Cardiff Half Marathon on 10/01/2023 was my second SuperHalfs race. The sky was cloudy, there was light rain, and there was high humidity, but I managed to get a good result. It was my season’s best. I never had any problem with the heat, but I felt a little bit of humidity.
- After Cardiff, I ran the MIB Half Marathon in Bucharest on 10/24/2023. I remember I had high hopes after Cardiff, but in the end, I got the same result as in Cardiff. The difference was just one second. During this race, I remember I felt the heat and wished for colder weather.
Temperature & Humidity Data
On Visualcrossing, you can get the data on an hourly basis. I will compare the data for all races from 10 AM, 11 AM, and 12 PM. One of the races in Bucharest started at 9:30, but getting 10–12 intervals will still be significant for our investigation.
| Time | Race | temp (c)| humidity %|
| — — — — — | — — — — — | — — — | — — — — — |
| 10:00 AM | Prague | 17.6 | 57.72 |
| 11:00 AM | Prague | 19.5 | 53.15 |
| 12:00 AM | Prague | 20.9 | 41.51 |
| 10:00 AM | Lisbon | 17.5 | 85.28 |
| 11:00 AM | Lisbon | 19.1 | 80.81 |
| 12:00 AM | Lisbon | 21.1 | 72.86 |
| 10:00 AM | Cardif | 18.1 | 87.04 |
| 11:00 AM | Cardif | 18.7 | 87.95 |
| 12:00 AM | Cardif | 18.9 | 87.2 |
| 10:00 AM | MIB | 15.4 | 72.99 |
| 11:00 AM | MIB | 18.5 | 58.19 |
| 12:00 AM | MIB | 21.6 | 48.7 |
Did I say that it is hard to get historical weather data? Wait to get to the point where you must draw a table on medium.com!
My race results were 1:50:05 Prague, 1:46:46 Lisbon, 1:45:35 MIB, and 1:45:34 Cardif.
Was the humidity the reason for making Prague more difficult? The data doesn’t support this at all. In Prague, the humidity was around 50%, while in Lisbon, the humidity was around 80%! The best result I got was in Cardiff, where the temperature was 1-2 degrees colder, and the humidity was close to 90% because it was raining lightly.
Humidity and temperature alone are insufficient to quickly determine whether the problem was the temperature or the humidity.
The Dew Point
I searched the internet and found many articles saying that all that matters is the “Dew Point.” I admit that I have never looked at the dew point till now.
Trying to read and understand the dew point, I did not find a completely clear answer for runners. I copied some of the definitions and discussed them with ChatGPT, and we came up with this explanation:
Dew Point for Runners: “In simple terms, the dew point is the temperature at which air becomes saturated with moisture, causing water vapor to condense into dew. For runners, this is important because the closer the dew point is to the actual air temperature, the more humid it feels. High dew points indicate more moisture in the air, which can make it harder for sweat to evaporate and cool your body effectively. This means running in high dew point conditions can feel more uncomfortable and strenuous.”
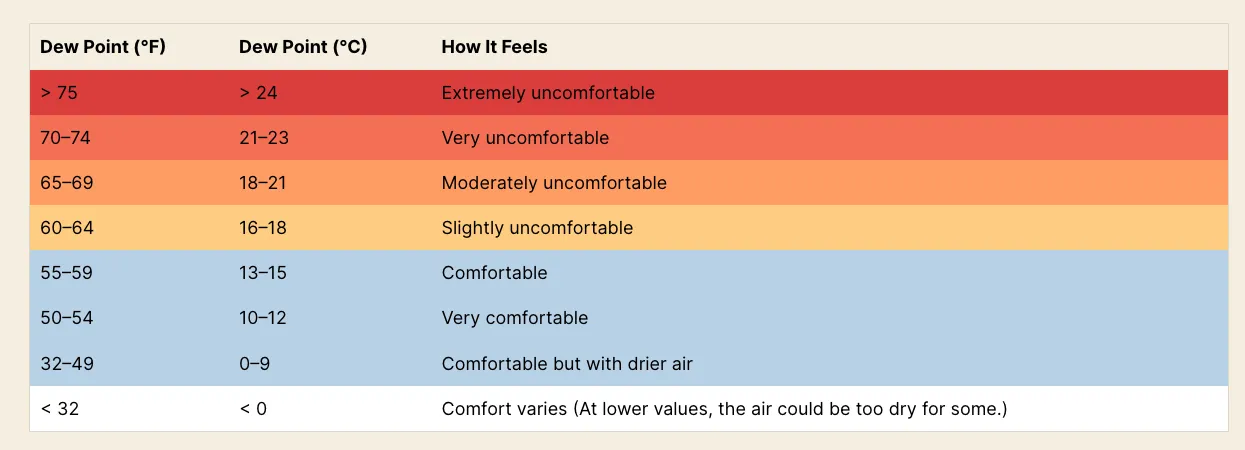
Is the data supporting this theory? Let’s see ( I gave up on doing ascii tables)
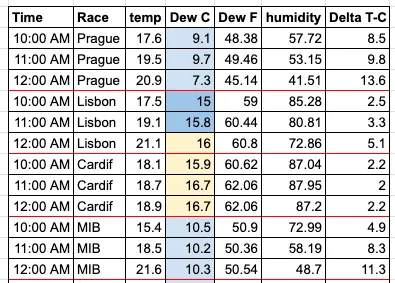
The Cardiff race doesn’t test the theory. It was a nice race where I got the best result out of all the races, and it had a small difference between the temperature and the dew point, and high humidity also. Same for Prague, the most difficult one.
This means that Dew Point may not be the answer, or the weather data may be inaccurate. I’ve Checked another website for Prague and found similar values https://www.wunderground.com/history/daily/cz/prague/LKPR/date/2024-4-6
If it is not the dew point, then what is it? Stay tuned for the second part of my article, when I continue researching the weather and how it influences running performance.
Next
https://therunningcat.blog/heat-and-running-part-2/
I'm a recreational runner with an office job, testing running science on my own legs. More about me.